The 96% Problem: Big Tech's AI Buildout Has Outgrown Its Own Cash Flow
In the three months to June 2026, five American companies spent $181.5 billion on property and equipment. Not on research, not on acquisitions, not on buybacks — on land, steel, transformers, cooling plant and silicon. Microsoft, Alphabet, Amazon, Meta and Oracle together laid out more capital in that single quarter than the entire annual capital budget of any country's rail network.
Two years earlier, in the first quarter of 2024, the same five companies spent $46.0 billion. The number has very nearly quadrupled in nine quarters.
That escalation is well covered. What is not well covered is the denominator. Capital spending is only meaningful next to the cash a business actually produces, and on that measure something has changed that has no precedent in the modern history of these companies: in the first half of 2026 the group spent 96 cents of every dollar of operating cash flow on capital expenditure. In 2019 the figure was 36 cents.
This article is the full record, drawn entirely from the companies' own filings with the U.S. Securities and Exchange Commission. Every figure below comes from SEC EDGAR XBRL data — 10-K and 10-Q cash-flow statements, aggregated to calendar quarters so that Microsoft's June fiscal year and Oracle's May fiscal year can be compared with Alphabet's calendar one. Nothing is estimated and nothing is guided; these are amounts already paid.
The complete table, 2019 to today
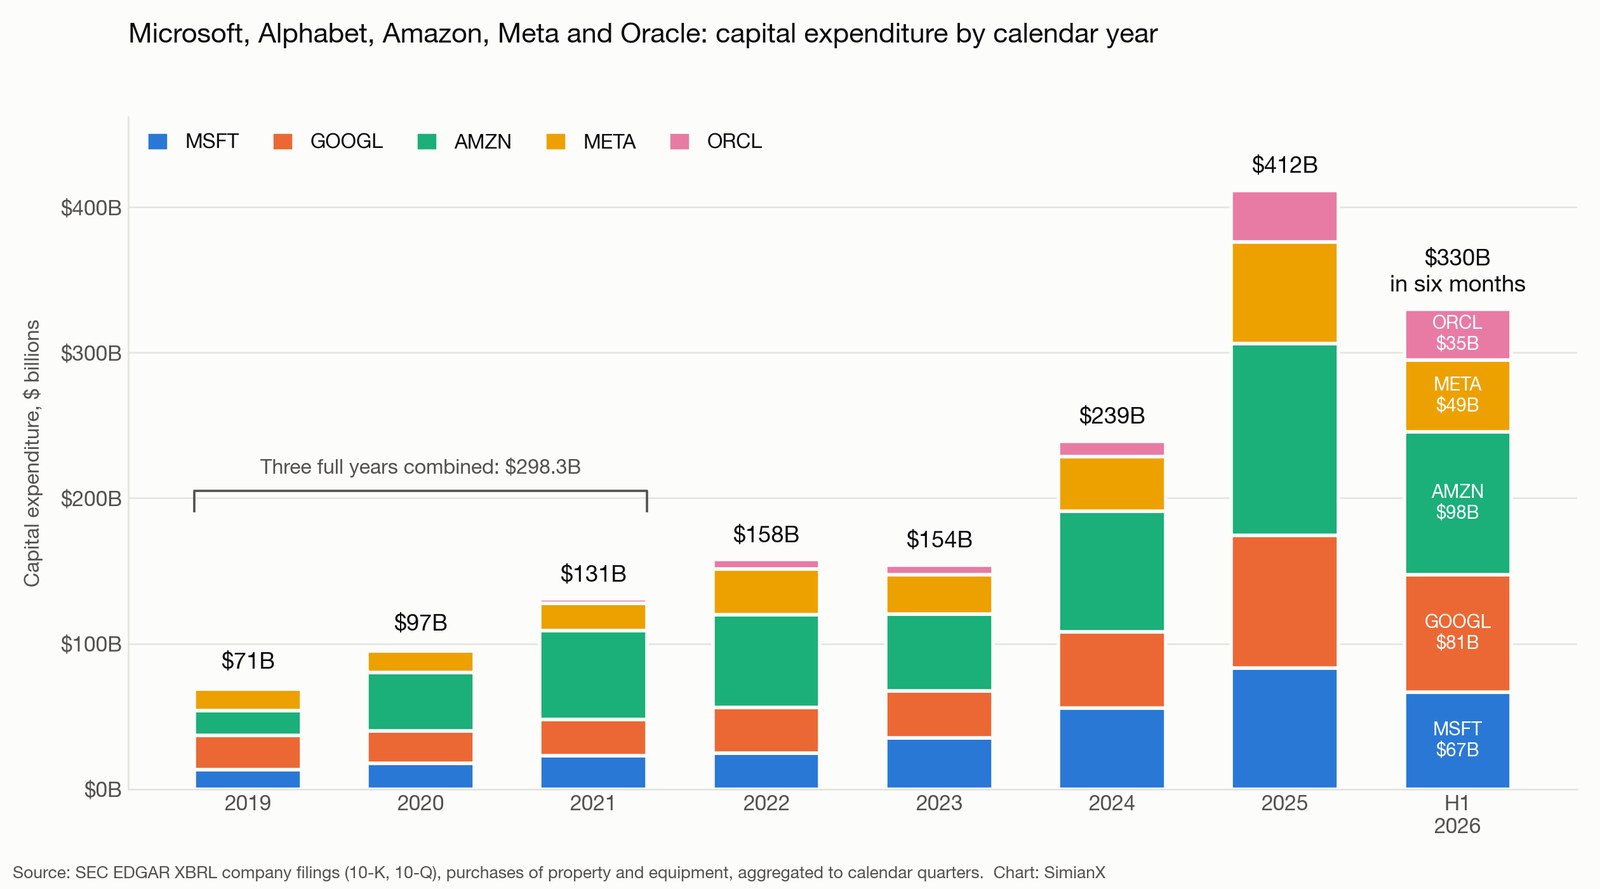
Figures are U.S. dollars in billions, purchases of property and equipment, aggregated to calendar quarters. The final row covers January to June 2026 only — six months, not twelve.
| Period | MSFT | GOOGL | AMZN | META | ORCL | Total |
|---|---|---|---|---|---|---|
| 2019 | 13.5 | 23.5 | 16.9 | 15.1 | 1.6 | 70.6 |
| 2020 | 17.6 | 22.3 | 40.1 | 15.2 | 1.8 | 97.0 |
| 2021 | 23.2 | 24.6 | 61.1 | 18.7 | 3.1 | 130.7 |
| 2022 | 24.8 | 31.5 | 63.6 | 31.2 | 6.7 | 157.8 |
| 2023 | 35.2 | 32.3 | 52.7 | 27.0 | 6.9 | 154.1 |
| 2024 | 55.6 | 52.5 | 83.0 | 37.3 | 10.7 | 239.1 |
| 2025 | 83.1 | 91.4 | 131.8 | 69.7 | 35.5 | 411.5 |
| H1 2026 | 66.7 | 80.6 | 98.4 | 49.1 | 35.1 | 329.9 |
The single most useful line in that table is the last one. The $329.9 billion these five companies spent in the first six months of 2026 is more than they spent in the whole of 2019, 2020 and 2021 combined — three full years, $298.3 billion. The buildout is not merely large; its recent rate of change is larger than the entire base it grew from.
It is also broad. This is not one company's bet. Alphabet's spending has risen roughly 3.4-fold since 2023. Meta's has more than doubled from 2024. Oracle, a company that spent under $2 billion a year on property before 2021, ran $35.1 billion through its cash-flow statement in six months — more, in half a year, than in the eight years to 2022 put together.
The number that actually matters
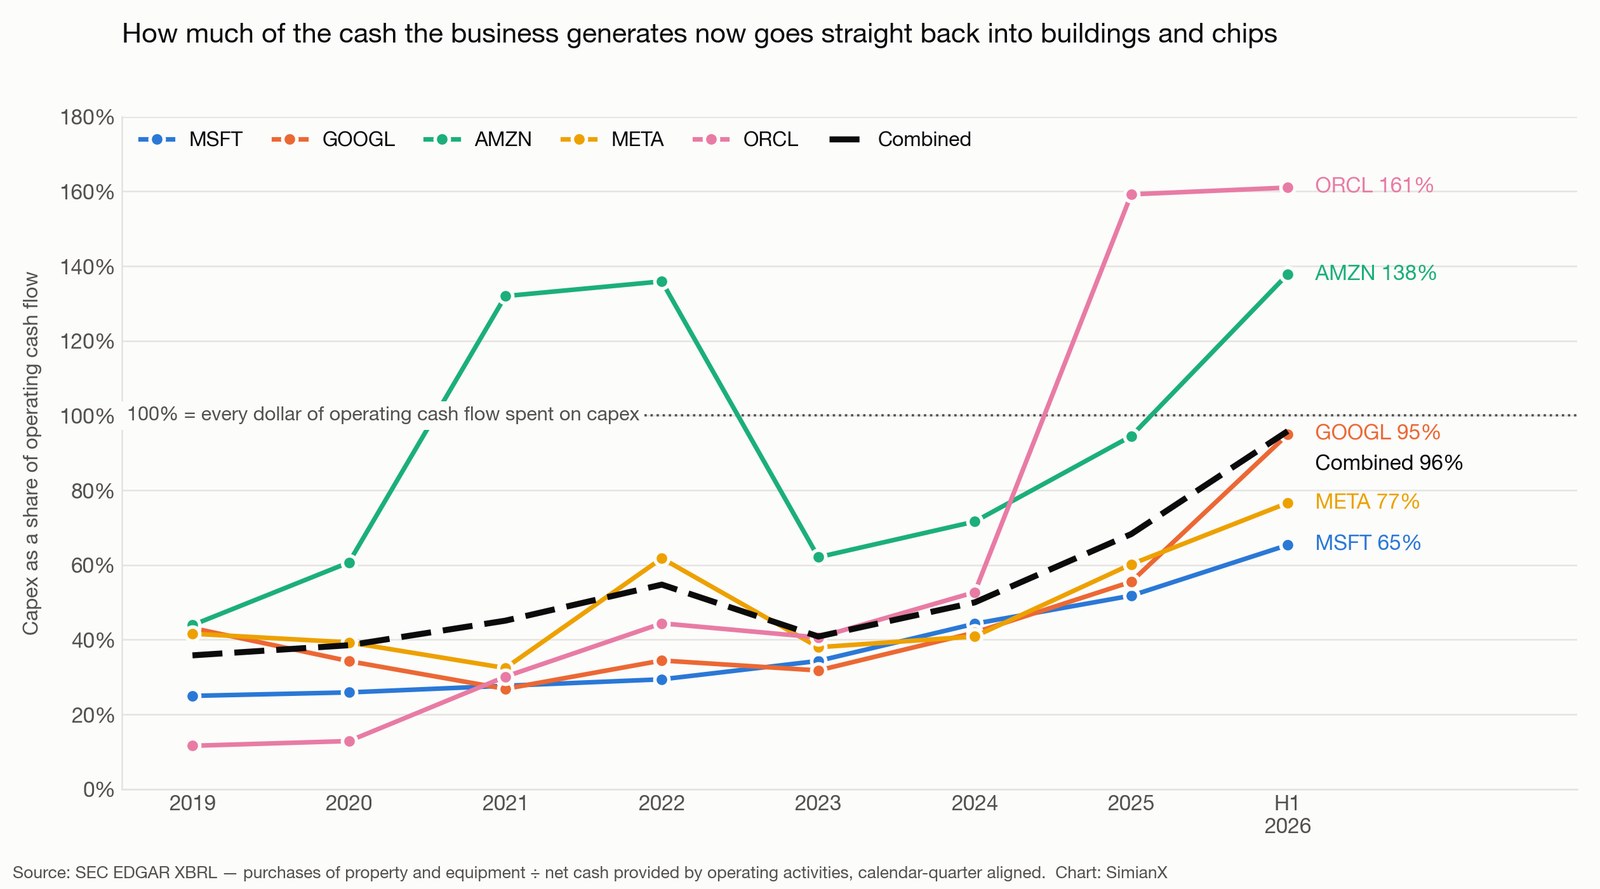
Absolute capex tells you the scale of the ambition. Capex as a share of operating cash flow tells you whether the ambition is affordable out of the existing business, or whether it requires outside money.
The distinction is not academic. A company spending 40% of its cash flow on capital projects is reinvesting. A company spending 140% is running a deficit, and that deficit has to be filled from the balance sheet, from the bond market, or from somewhere else.
| Period | MSFT | GOOGL | AMZN | META | ORCL | Combined |
|---|---|---|---|---|---|---|
| 2019 | 25% | 43% | 44% | 42% | 12% | 36% |
| 2020 | 26% | 34% | 61% | 39% | 13% | 38% |
| 2021 | 28% | 27% | 132% | 32% | 30% | 45% |
| 2022 | 29% | 34% | 136% | 62% | 44% | 55% |
| 2023 | 34% | 32% | 62% | 38% | 41% | 41% |
| 2024 | 44% | 42% | 72% | 41% | 53% | 50% |
| 2025 | 52% | 55% | 94% | 60% | 159% | 68% |
| H1 2026 | 65% | 95% | 138% | 77% | 161% | 96% |
Three things stand out.
Oracle crossed 100% in 2025 and has stayed there. It is now spending roughly $1.61 of capital for every dollar of cash its operations generate — a structurally different company from the software licensor it was five years ago, and the reason ORCL's 2026 has looked so different from its 2025.
Amazon is above 100% again, at 138%. That matters because Amazon has been here before, and we know how that story ended. More on this below.
Microsoft is the conservative one, and it is still spending 65 cents on the dollar — a level that would have been considered aggressive for any of these businesses as recently as 2023. There is no restrained member of this group any more; there is only a slower one. Microsoft's own quarterly commentary has been explicit that the constraint is physical capacity rather than demand.
What is left over, and who is lending
Free cash flow is what remains after capital spending — the money available for dividends, buybacks, debt repayment and acquisitions. For the five companies combined it has effectively vanished.
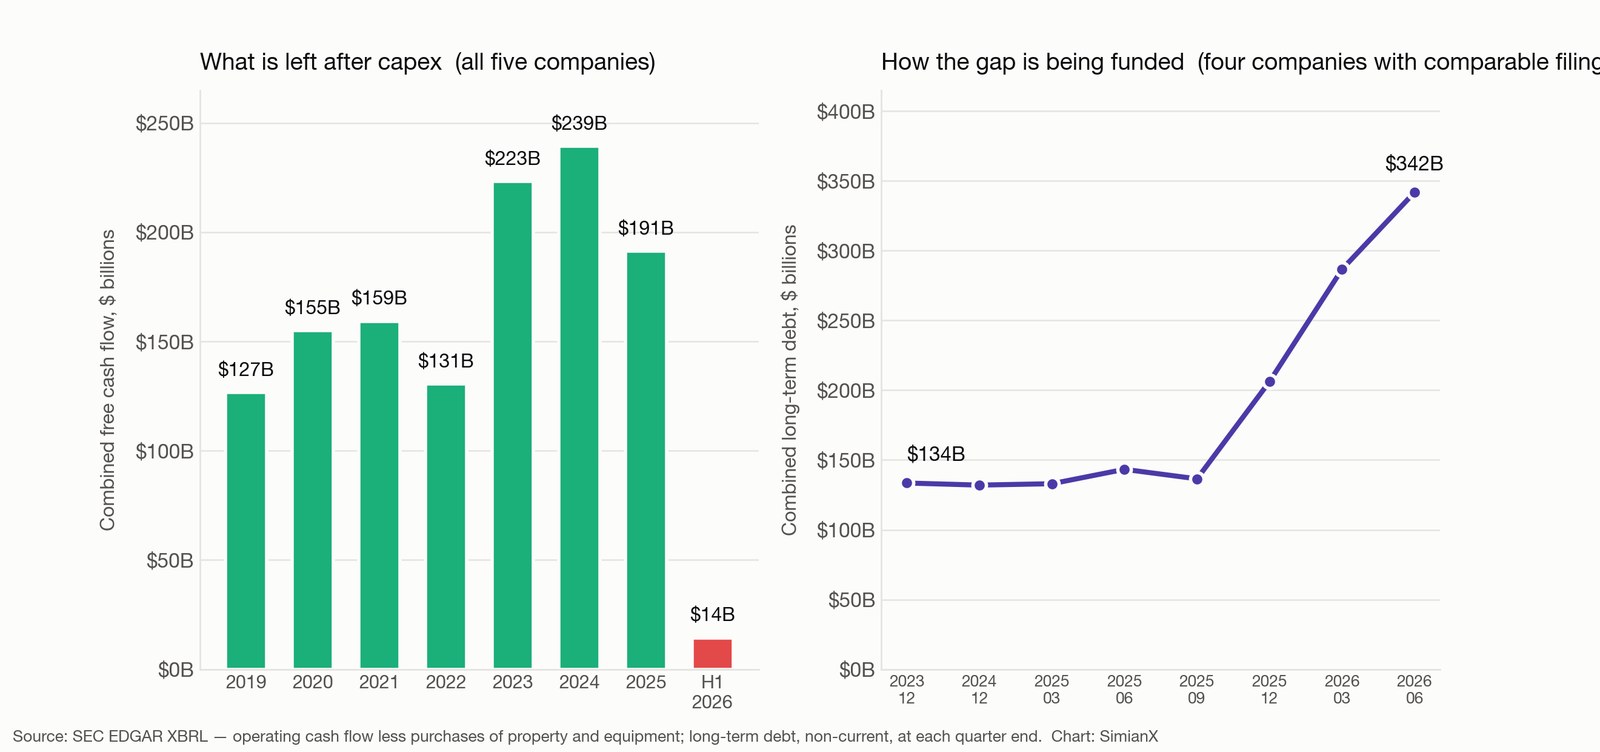
| Period | Operating cash flow | Capex | Free cash flow |
|---|---|---|---|
| 2019 | 197.2 | 70.6 | 126.6 |
| 2021 | 289.9 | 130.7 | 159.2 |
| 2023 | 377.3 | 154.1 | 223.2 |
| 2024 | 478.4 | 239.1 | 239.3 |
| 2025 | 602.8 | 411.5 | 191.3 |
| H1 2026 | 344.3 | 329.9 | 14.4 |
Operating cash flow has not fallen. It rose from $197.2 billion in 2019 to $602.8 billion in 2025, and the first half of 2026 ran at a similar pace. These remain extraordinarily profitable businesses. The change is entirely on the spending side, and it has taken combined free cash flow from $239.3 billion in 2024 to $14.4 billion in six months.
Money that is not generated has to be borrowed, and the filings show exactly that. Long-term debt across Microsoft, Alphabet, Amazon and Meta — the four whose balance-sheet disclosures are directly comparable — sat at $133.5 billion at the end of 2023 and $132.0 billion at the end of 2024. It was $341.9 billion on 30 June 2026.
| Company | Long-term debt, Dec 2024 | Long-term debt, Jun 2026 |
|---|---|---|
| Alphabet | 10.9 | 98.2 |
| Amazon | 52.6 | 128.9 |
| Meta | 28.8 | 83.7 |
| Microsoft | 39.7 | 31.1 |
| Combined | 132.0 | 341.9 |
Alphabet's long-term debt has risen roughly ninefold in eighteen months. Amazon raised $67.0 billion of long-term debt in the first half of 2026 alone, having raised essentially none in either 2023 or 2024. Oracle, reported on its own May fiscal year, carried $129.5 billion of total debt at the end of fiscal 2026 against $92.6 billion a year earlier.
Microsoft is the exception, and deliberately so: its long-term debt has fallen from $39.7 billion to $31.1 billion over the same period. It is funding a $133 billion annualised capital programme out of cash flow, which is precisely why its intensity ratio is the lowest of the five.
There is a rate dimension here that was absent from the last capital cycle. This borrowing is landing in a bond market where the 30-year U.S. Treasury yielded 5.24% and the 10-year 4.78% on 4 September 2026, according to the Treasury's daily par yield curve. Investment-grade issuers borrow at a spread above those levels. The last time these companies built at scale, the risk-free rate had a zero in front of it. We covered the long-end repricing itself in the 2026 global bond selloff; this is the corporate side of the same story.
Depreciation is the bill that arrives later
Capital expenditure does not hit the income statement when the cheque is written. It arrives later, spread across the asset's useful life, as depreciation. That timing gap is what makes a capex boom look painless for two or three years and then stop looking painless.
The bill is already visible. Amazon's depreciation and amortisation reached $65.8 billion in 2025. Alphabet's rose from $11.9 billion in 2023 to $21.1 billion in 2025. Meta's went from $11.1 billion to $18.4 billion over the same two years, and Oracle's from $2.9 billion to $5.2 billion.
Now apply the arithmetic. A GPU cluster depreciated over six years turns roughly $412 billion of 2025 spending into something on the order of $69 billion of annual depreciation once it is fully in service — and 2026 is running far above 2025. Each incremental year of buildout adds a permanent, recurring charge to operating income that does not go away when the spending stops. It goes away six years after the spending stops.
This is the mechanism by which a capex cycle becomes an earnings cycle, and it is why the useful-life assumptions in these filings deserve more attention than they get. Extending an assumed server life from four years to six years reduces annual depreciation by a third and flatters reported margins accordingly. It does not extend the physical life of the hardware.
Amazon has run this experiment before
The most useful thing in the intensity table is not 2026. It is 2021 and 2022.
Amazon's capital spending ran at 132% of operating cash flow in 2021 and 136% in 2022 as it doubled its fulfilment network. The market's verdict was unambiguous: AMZN fell 50% in 2022. Amazon then cut capex from $63.6 billion to $52.7 billion in 2023, intensity dropped to 62%, and the stock rose 81% that year.
Meta ran the same experiment on a shorter timeline. Its intensity hit 62% in 2022 during the metaverse buildout, the stock fell 64%, spending was held down in 2023 — and META rose 194%.
Both years were difficult for the whole market; the S&P 500 fell 19% in 2022 and rose 24% in 2023. But the amplitude is the point. The companies that let capital intensity run well past what investors would fund were punished several times harder than the index, and they re-rated violently the moment they demonstrated discipline. Neither business was broken in 2022 and neither was transformed in 2023. What changed was the spending line.
That is the pattern worth carrying into 2026: for this cohort, the market has historically paid for capital discipline far more reliably than it has paid for capital ambition.
What the market has already decided
The scoreboard through 4 September 2026 is instructive. Total returns are price-only, from the last close of 2025.
| Ticker | Capex / cash flow, H1 2026 | 2026 year-to-date | 2025 |
|---|---|---|---|
| ORCL | 161% | −18.5% | +17% |
| AMZN | 138% | +12.0% | +5% |
| GOOGL | 95% | +8.1% | +65% |
| META | 77% | −6.6% | +13% |
| MSFT | 65% | +3.3% | +15% |
| NVDA | — | +23.5% | +39% |
| S&P 500 (SPY) | — | +12.9% | +16% |
All five of the biggest spenders have underperformed the S&P 500 in 2026. Nvidia, which receives a large share of that spending rather than making it, has beaten the index by more than ten points. The market is paying the seller of the equipment, not the buyers of it — a rotation we traced through the semiconductor complex earlier this year and one that also lifted memory suppliers such as Micron.
The relationship is not mechanical. Amazon has the second-highest intensity in the group and the best year-to-date return among the five, because investors credit it with a track record of converting capital into cash. Oracle, whose contracted backlog is enormous but whose cash conversion is unproven, gets no such benefit of the doubt. Intensity alone does not determine the outcome; intensity plus credibility does.
How to check any of this yourself
Everything in this article can be reproduced without a data subscription. The SEC publishes structured XBRL data for every filer through its public company-facts API. The concept you want is PaymentsToAcquirePropertyPlantAndEquipment — some filers, Amazon and Nvidia among them, use PaymentsToAcquireProductiveAssets instead. Divide it by NetCashProvidedByUsedInOperatingActivities for the intensity ratio, and take the difference for free cash flow.
One methodological trap is worth flagging. Most filers report cash-flow items as year-to-date cumulative figures, not discrete quarters, so a naive read of a Q3 10-Q gives you nine months of spending rather than three. Difference consecutive year-to-date values within each fiscal year before comparing anything, and align to calendar quarters if the group has mixed fiscal calendars. Skipping that step is the most common reason two published capex tables disagree.
If you would rather watch the market's reaction to these numbers in real time than reconstruct them, the SimianX live analysis room runs multi-agent coverage of individual tickers as prints land, and the stock research pages carry the fundamental record alongside it. Auto Digest delivers the same coverage as a daily briefing.
Frequently asked questions
Is $330 billion in six months evidence of an AI bubble?
It is evidence of an enormous capital cycle, which is not the same thing. The distinguishing feature of a bubble is a gap between spending and the revenue that eventually services it, and that gap is not yet measurable — the assets bought in 2026 will not be fully in service until 2027. The honest position is that the question is open, and that depreciation schedules will answer it before analysts do. Our survey of every tech bubble since 1929 sets out what the earlier ones had in common.
Why does capex divided by operating cash flow matter more than capex divided by revenue?
Because revenue is not available to spend. Operating cash flow is what the business actually generates after paying its costs and its working-capital needs, and it is the pool a capital programme is funded from before any borrowing. A ratio above 100% is arithmetically a statement that the company is spending money it did not earn this period.
Which of these companies is most exposed if spending has to slow?
On the filings alone, Oracle. It has the highest intensity at 161%, the least established cash-conversion history in cloud infrastructure, and the largest proportional increase in debt. Microsoft is the least exposed: lowest intensity, falling debt, and a capital programme funded out of cash flow. That ranking reflects balance-sheet arithmetic, not a view on either company's contracts.
Does higher capex mean higher future earnings?
Eventually, if the capacity is used. In the meantime it means higher depreciation with certainty and higher revenue only with probability. That asymmetry is why the market has become more discriminating about which of these programmes it is willing to fund, and why Meta's disclosure about excess capacity was read the way it was.
Are the smaller AI infrastructure companies doing the same thing?
At far greater relative risk, yes. The hyperscalers are funding this from the strongest cash-flow statements in the world. Companies such as CoreWeave and TeraWulf are building comparable capacity against contracted backlogs and borrowed money, without the same cushion. The same is true across the power and cooling supply chains that this spending flows into.
If the biggest spenders underperform, should I just own Nvidia?
That has worked in 2026, and it worked in 2023 and 2024 as well — but it concentrates the position in a single point of the chain, priced for continued acceleration. Every Nvidia earnings reaction since 2016 shows how sharply that expectation can reprice on a single print. The broader concentration risk in the Magnificent 7 is the same trade viewed from the index level.
What should I watch next?
Three lines in the next set of 10-Qs, in order: the capex figure itself, the depreciation line beneath it, and any change to stated useful lives for servers and network equipment. The first tells you the ambition, the second tells you the cost already committed, and the third tells you whether reported margins are being supported by an accounting assumption rather than by the business.
The bottom line
The AI buildout has crossed from being funded by profits to being funded by balance sheets. Five companies that generated $344.3 billion of operating cash flow in six months spent $329.9 billion of it on capital projects and borrowed to cover the rest, taking their combined long-term debt from $132.0 billion at the end of 2024 to $341.9 billion by June 2026 — into a bond market pricing thirty-year money above 5%.
None of this makes the investment wrong. Amazon's fulfilment buildout, the closest analogue in this cohort, was widely criticised in 2022 and looks like a reasonable decision from 2026. But it does change what an investor is underwriting. Until 2024 these were cash-generative businesses that also invested. In 2026 they are capital projects attached to cash-generative businesses, and they should be valued with the tools appropriate to that: intensity ratios, funding sources, depreciation schedules and useful-life assumptions.
The five numbers to keep are 96%, $329.9 billion, $14.4 billion, $341.9 billion and 5.24%. Together they describe a spending programme that has outgrown its own cash flow and now depends on the price of long-term credit.
Sources. Capital expenditure, operating cash flow, depreciation and long-term debt: SEC EDGAR XBRL company-facts data from 10-K and 10-Q filings by Microsoft, Alphabet, Amazon, Meta and Oracle, aggregated to calendar quarters. Treasury yields: U.S. Department of the Treasury daily par yield curve, 4 September 2026. Equity returns: daily closing prices through 4 September 2026, price return only, dividends excluded. Charts produced by SimianX from the underlying filing data. See capital expenditure for the accounting definition used throughout.
Related reading
- Global Bond Selloff 2026: 30-Year Yields at 19-Year Highs — the cost of the debt funding this buildout
- Is Jensen Huang Fueling an AI Bubble? Nvidia's Boom Examined — the other side of the same cash flow
- Amazon Q2 Earnings 2026: Can AWS Justify $200B AI Capex? — the single largest spender, in detail
- Alphabet Q2 Earnings 2026: Can Gemini, Cloud Justify Capex? — the fastest increase in the group
- NVIDIA-IREN 2026: The $2.1B 5GW AI Factory Power Trade — where the money physically goes